Apology and Principal Conclusions
The individual sections of this paper as outlined on the cover page are currently under revision. I apologize for this delay, which was due principally to the mistakes in the earlier versions. As of the early afternoon of October 16, 2006, I have completed all but Methods, The Effect of Political Economy on Total Energy Budget and EROI, and Executive Summary.
Please see Charts 1 and 2 illustrating the principal results:
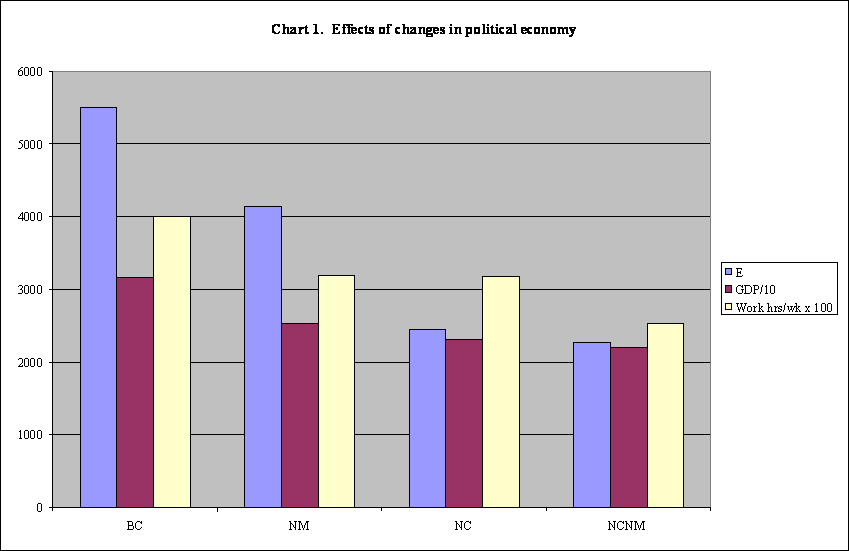
This chart illustrates the changes in total energy budget, EROI, and the amount of work performed in each sector to maintain a constant standard of living when an American-style market economy (BC) changes to a market economy where everyone is paid the same (NM), that changes to a planned economy with a commissar class that earns what managers earned in the Base Case (NC), that changes to a planned economy (or, better yet, a give-away economy) where everyone is paid the same (NCNM). This chart will appear on each of the two spreadsheets http://dematerialism.net/Mark-II-Economy.xls and http://dematerialism.net/Mark-II-Economy-CSP.xls.
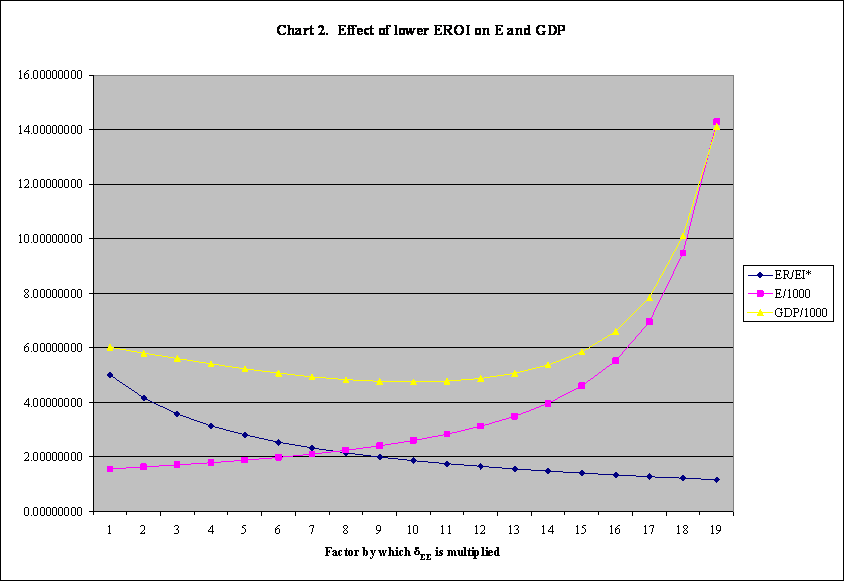
This chart illustrates the effect of lowering the EROI due to substituting a less efficient technology for the technology that preceded it chronologically. One sees the total energy budget, E, approaching infinity as EROI diminishes toward 1.0. In this paper, I have defined Energy Returned to be the total energy extracted or produced. This is the sum of the energy delivered and the energy invested. An alternative definition counts only the energy delivered. This has the advantage that it is easily computed in practice. For example, if a Concentrated Solar Power (CSP) installation is rated at 500 MW with an operating factor of 0.3 and a plant life of 30 years, ER = 500 MW · 0.000001 TW/MW · 0.3 · 30 years = 0.012 terawatt-years = 39 billion kilowatt-hours. If the alternative definition is used, each of EROIs is reduced by exactly 1.0 and the total energy budget approaches infinity as EROI-1 approaches zero. This result is illustrated graphically in Chart 1 on each of the two spreadsheets http://dematerialism.net/Mark-II-Economy.xls and http://dematerialism.net/Mark-II-Economy-CSP.xls.
Thomas L Wayburn
Houston, Texas
October 16, 2006