Energy in a Natural Economy
Table of Contents
In the book On the Preservation of Species (POS), on my homepage, and in some of my essays, I have made the assertion that the energy consumed by an American-type, Capitalist-style, quasi-market economy in simply dividing up the pie is wasted and is not affordable in the shadow of Peak Oil. Whereas, Capitalism enriches a small fraction of the population, it more or less impoverishes most of the rest of the population, even those who favor Capitalism – presumably because they keep hoping that they will be one of the lucky ones who become rich even though their chances of doing so are negligible.
The poor in a rich imperialist country like the United States consume more real wealth than the poor in a Third World country, therefore their exploiters can keep them quiet with constant reminders as to how much better off they are than people elsewhere. They do consume much more than poor people elsewhere, however most of the excess wealth enjoyed by America’s poor is consumed in unpleasant lifestyles replete with long trips and frequent commutes in an uncomfortable and unsafe automobile that belches noxious fumes that endanger everyone, including rich drivers of expensive cars who chalk it up to the unavoidable cost of poverty. Incidentally, the lavish lifestyle of all Americans, even the poor, excites the righteous indignation of people, even rich people, in poor nations whose sole recourse is what journalists refer to as terrorism. Of course, the War on Terror is not intended to address this problem, but rather to control tightly the portion of the population in the rich nation who might notice this deception and conceivably wish to attempt a remedy of their own.
The two most important aspects of employment, according to the conventional wisdom, are (i) the amount of effort put into it and (ii) the wages received. Thus, employment is viewed on the left and on the right as a useful adjunct to a good life. This has catastrophic effects for the environment. Clearly, the consumption of high-grade energy (especially fossil fuels) is directly proportional to employment: first, because of energy consumed on the job and, second, because of the increased consumption of employed persons (and their dependents) over what they might have consumed were they not employed. Moreover, energy consumption leads to greater environmental destruction due to feverish activity, waste products, population growth, and much more. (See http://dematerialism.net/Chapter 7a.html.)
A much more useful view of employment is almost never taken, namely, that the two most important aspects of employment are (i) the cost to the environment and (ii) the usefulness to the world of the products, e.g., food, clothing, shelter, health care, central heating and cooling, a few simple luxuries to take the misery out of life, and, from our viewpoint, computers and communications. According to this view, the world would be much better off if people who produce nothing useful would quietly amuse themselves at whatever they enjoy doing most, with which it is the purpose of a good education to acquaint them. Most people would not object to this arrangement provided they received the same living and enjoyed the same status as everyone else. Certainly, they should not expect more.
The purpose of this exercise is to determine roughly what percentage of the national energy budget of the US could be saved by switching (gradually, but persistently) to a non-coercive, non-hierarchical voluntarily-planned decentralized economy. If we can save the energy consumed by competition for wealth, we can meet the challenge of living in a post-Peak-Oil economy.
The Bureau of Labor Statistics provides tables of employment by sector for the year 2000 at http://www.census.gov/epcd/cbp/view/us00.txt. Using these numbers together with estimates of 18 million (non-military) employed by government (14%) and 1.4 million military (~1%), I compute less than 16% employed in agriculture; about 12% (15,382,376) employed in manufacturing (except for manufacture of vehicles) plus residential construction (unnecessary in a stable population with homes built to last); 4% non-health-care professionals, scientists, and engineers, but not lawyers; 11% in health care and social assistance; and 2% in education. This amounts to 45% of 130 million people employed, however many of these people are not needed in a planned economy. (I have neglected librarians, but I don’t have a separate figure for librarians and I can’t tell what proportion of the 7,831,630 employed during 2003 in Education, Training, and Library were engaged in training people to engage in useless activities.)
The population on or about the turn of the century was 294,000,000 people of whom approximately 130,000,000 were employed. The distribution by occupation according to the Occupational Employment Survey of the Bureau of Labor Statistics for 2003 <http://stats.bls.gov/oes/home.htm> is shown in the first two columns of Table 1, except that 19,400,000 government employees, which includes 1,400,000 military personnel, 1,906,370 self-employed farmers (according to Calvin Beale of the USDA), and 12,200,000 non-agricultural self-employed people are added to the BLS figures.
In a natural economy, not all of these workers are needed; therefore, in the third column of Table 1, many are furloughed according to dematerialist principles. In particular, commercial, financial, and managerial employment can be dispensed with. Moreover, most computational and mathematical work is done in support of commerce, finance, and corporate industry. Such legitimate mathematical and computational work as can be justified in a natural economy can be done in a recreational mode and will not incur the energy costs normally associated with other economic activities. Similar remarks can be applied to arts, design, entertainment, sports, and media. Also, 90% of education, training, and library can be dispensed with under similar guidelines. Genuine instruction in liberal arts and science account for 10% of all such employment at best. It is fair to assume that most medical problems arising from the stressful lives led by competitors for wealth and power will not occur in a natural economy; therefore, at least half of all medical employees can employ themselves on their own time at whatever interests them even if it be medical research after all. Finally, before discussing the savings in manufacturing and transportation that result from the reduction in economic activity discussed in this paragraph, I should note that perhaps 10% of all food preparation and serving that has economic ramifications is needed to take care of those who cannot help themselves and for whom no immediate family member is available to help them. Regrettably, the many enjoyable experiences associated with dining in good restaurants, as opposed to junk-food establishments, are likely to become a thing of the past in the wake of Peak Oil except as provided by amateur chefs for their good friends and other connoisseurs of fine dining.
It can be determined by recursion what fraction of manufacturing (production) and transportation are no longer needed because of reductions of activity elsewhere in the economy. This computation was carried out on an MS Excel spreadsheet, which was subsequently lost. I will have to repeat the computation if anyone challenges the conclusion.
|
Table 1. Actual employment in 2003 |
||
|
Occupation |
Number employed |
Total furloughed |
|
Management |
6653480 |
6653480 |
|
Business and Financial Operations |
4924210 |
4924210 |
|
Computer and Mathematical |
2827010 |
2827010 |
|
*Architecture and Engineering |
2376650 |
|
|
*Life, Physical, and Social Science: |
1113130 |
|
|
Community and Social Services |
1615610 |
1615610 |
|
Legal |
951510 |
951510 |
|
7831630 |
6265304 |
|
|
Arts, Design, Entertainment, Sports, and Media |
1538150 |
1538150 |
|
*Healthcare Practitioners and Technical |
6173760 |
3086880 |
|
Healthcare Support |
3208770 |
3208770 |
|
Protective Service |
2999630 |
2999630 |
|
Food Preparation and Serving |
10216620 |
9194958 |
|
Building and Grounds Cleaning and Maintenance |
4260380 |
|
|
Personal Care and Service |
2988590 |
2988590 |
|
Sales and Related |
13534180 |
13534180 |
|
Office and Administrative Support |
22678010 |
22678010 |
|
*Farming, Fishing, and Forestry |
461630 |
|
|
Construction and Extraction |
6085510 |
3042755 |
|
*Installation, Maintenance, and Repair |
5226080 |
|
|
*Production |
10488450 |
7259402 |
|
Government and Mil |
19400000 |
|
|
Agriculture self employed |
1906370 |
|
|
Other self employed |
12200000 |
12200000 |
|
Transportation |
9414920 |
6516377 |
|
Totals |
161074280 |
111484825 |
In 2003, it appears that we could dispense with 69.2% of all economic activity in a natural economy; but, this result is illusionary because of the huge amount of manufacturing and other modes of production that are carried out abroad that subsidize consumption in the US. Also, the so-called green revolution and the associated trend toward factory farming has reduced the number of agricultural workers in an unsustainable way. Therefore, by prorating this data from the BLS preserved at http://www2.census.gov/prod2/statcomp/documents/1950-03.pdf using the break-down of economic activity in 1940, Table 222, p. 184, I have been able to assign a value to the number of agricultural employees and the number of employees engaged in production based upon the same fractions of the total population that worked in these sectors in 1940 when the US was more than self-supporting and before the pernicious factory farms had supplanted agricultural methods that were nearly sustainable, and, with some adjustments, can be rendered totally sustainable. The results are shown in Table 2 below.
|
Table 2. Employment in 2003 under the assumption that the US is self-supporting |
||
|
Occupation |
Number employed |
Total furloughed |
|
Management |
6653480 |
6653480 |
|
Business and Financial Operations |
4924210 |
4924210 |
|
Computer and Mathematical |
2827010 |
2827010 |
|
*Architecture and Engineering |
2376650 |
|
|
*Life, Physical, and Social Science: |
1113130 |
|
|
Community and Social Services |
1615610 |
1615610 |
|
Legal |
951510 |
951510 |
|
*Education, Training, and Library |
7831630 |
6265304 |
|
Arts, Design, Entertainment, Sports, and Media |
1538150 |
1538150 |
|
*Healthcare Practitioners and Technical |
6173760 |
3086880 |
|
Healthcare Support |
3208770 |
3208770 |
|
Protective Service |
2999630 |
2999630 |
|
Food Preparation and Serving |
10216620 |
9194958 |
|
Building and Grounds Cleaning and Maintenance |
4260380 |
|
|
Personal Care and Service |
2988590 |
2988590 |
|
Sales and Related |
13534180 |
13534180 |
|
Office and Administrative Support |
22678010 |
22678010 |
|
*Farming, Fishing, and Forestry |
461630 |
|
|
Construction and Extraction |
6085510 |
3042755 |
|
*Installation, Maintenance, and Repair |
5226080 |
|
|
*Production |
23317919 |
14895720 |
|
Government and Mil |
19400000 |
|
|
Agriculture self employed |
18692177 |
|
|
Other self employed |
12200000 |
12200000 |
|
Transportation |
9414920 |
6014345 |
|
Totals |
190689555 |
118619112 |
Although 62.2 % represents substantial savings, it is slightly less than the 69.2% calculated in Table 1, which was illusory. It is the movement of manufacturing and other modes of production overseas that induces some incautious analysts to assume that there is more room for energy conservation in our so-called information economy than there really is.
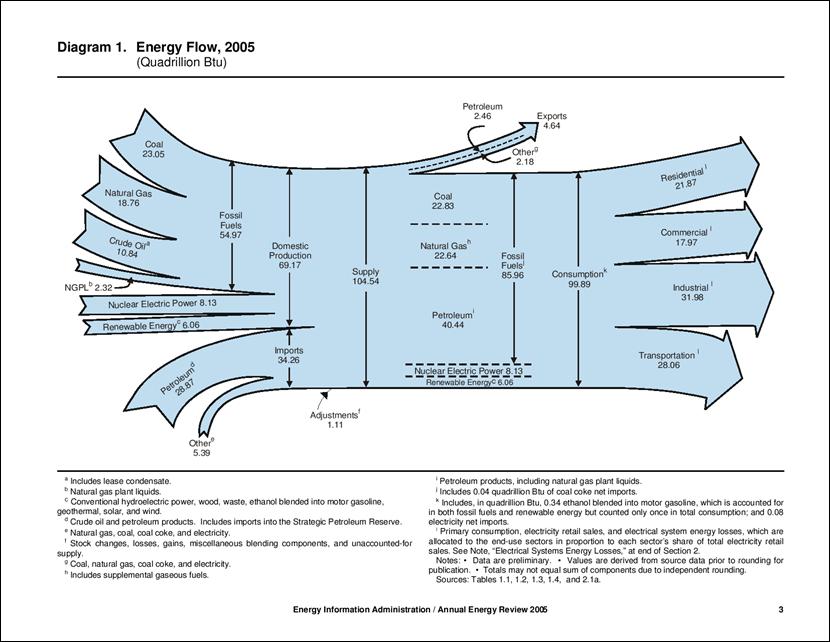
In governmental circles, energy is often measured in units of a quadrillion British Thermal Units or quads. In this essay, I shall let the unit quad refer to a rate of energy flow equal to one-quadrillion BTUs per year. The conversion to units of one-trillion Watts or one terawatt (TW) is achieved by multiplying figures in quads by 0.0334372 TW/quad. (Incidentally, the reader may find it useful to convert one million barrel per day of petroleum flow to 0.073 trillion watts or 0.073 terawatts (TW).)
Diagram 1 can be found on p. 3 of the Annual Energy Review 2005, published by the Energy Information Administration of the Department of Energy. The government does do useful things in case any of us wondered. Nevertheless, I have furloughed the 18 million government employees in my all-volunteer-governmental-service (including non-compulsory economic planning) hypothetical natural economy for post-Peak-Oil America. The URL is http://www.eia.doe.gov/aer/pdf/pages/sec1.pdf in case you cannot read the printing on the copy reproduced below.
Better diagrams with slightly different numbers appear below:
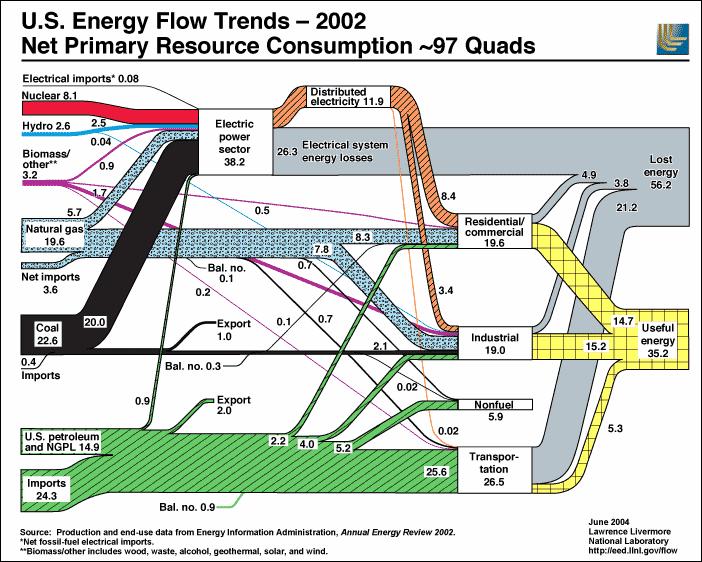
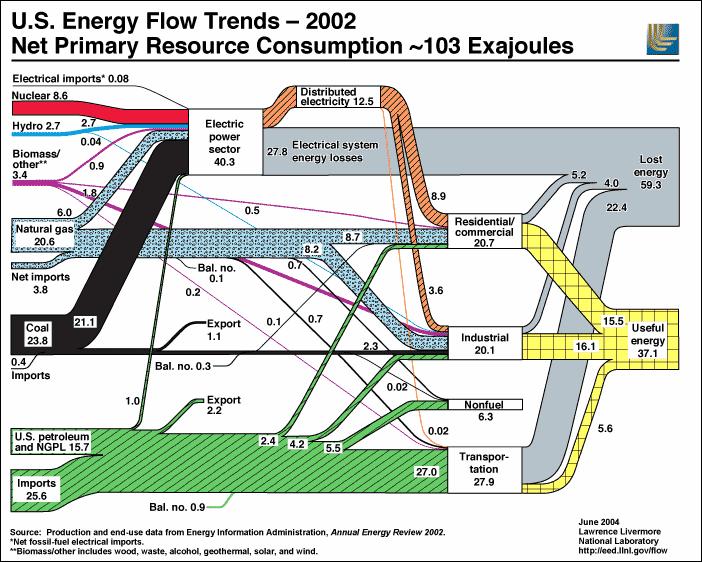
According to the DOE data for 2003, the total energy budget for the United States was 98.273 quads. Since one quad/year = 0.0334372 TW, this converts to energy expenditure at the rate of 3.286 TW. Of this, 22.99 quads (or 0.769 TW) was residential usage. (While it is true that I could have reduced residential consumption by a factor of two by assuming that routine conservation measures would be carried out, it is also true that furloughed US American workers are likely to incur energy expenses in their residences in connection with the pursuit of their legitimate interests that supplant the economic activities that they would normally have carried out on the job.) The sum of commercial (21.877), industrial (34.401), and transportation (19.909) is 75.287 quads. As shown in Table 3, we can reduce this to 21.201 quads or 0.709 TW. The sum of 0.769 + 0.709 = 1.478 TW represents a savings of 55% of 3.286 TW. According to http://www.eia.doe.gov/iea/overview.html, the world energy budget for 2003 was 421.714 quads or 14.101 TW. Thus, instead of 23.3% of the world budget, the US would be using 10.5% of the world’s energy production, which would not be affected by the US American conversion to renewables. This is sustainable provided that the measures suggested at http://www.dematerialism.net/CwC.html#_Toc149364221 and in the section entitled “A Natural Political Economy” at http://dematerialism.net/wiki.htm are adopted. It should be noted here that the saving in energy computed here supersedes all other computations in earlier essays. Furthermore, we might be able to do better:
In a world without sales, marketing, parasitic management, authoritarian propaganda, mass-market media, high-profile professional sports and their absurd, over-priced venues, and in a world without wasteful, cruel, and unnecessary war machines, and vast, authoritarian governments many things that are manufactured and maintained nowadays will not be needed. (In the wake of materialism there will be no one to spy on, regulate, prosecute, punish, persecute, or tax.) Also, in a non-materialistic world there need be no business or recreational transportation nor anyone commuting to a useless, boring job. Just think of all the energy savings that can be effected in a world with no monetary system, no banks, no financial services of any kind, no money, debts, bonds, stocks, or liens. Finally, with the developed world using ~90% less energy, the infrastructure to provide energy can be reduced proportionately.
An energy budget of 1.478 TW would be greater than the current world average; but, instead of consuming five times the world average, our consumption would be only about twice the world average. This would constitute a show of good faith such that we would be safe forever from terrorism. Moreover, we might be able to produce most of 1.478 TW (or less) from renewable technologies and supply the rest by using coal for as long as it takes to decentralize, de-urbanize, convert to small sustainable technologies, and progress further along the path to a safe, sustainable, natural society – in short, a family of brothers, sisters, mothers, fathers, and children living in harmony with Nature and with each other. If there are any religious inferences to be drawn from this, I leave it to the reader to draw them.
Houston, Texas
September 10, 2004
Revised March 24, 2007